functional magnetic resonance imaging (fMRI) blood Nature Reviews | Neuroscience. Time (sec) In summary, there are several approaches for dealing.
12 pages
156 KB – 12 Pages
PAGE – 1 ============
Much of what is currently known about brain func -tion comes from studies in which a task or stimulus is administered and the resulting changes in neu -ronal activity and behaviour are measured. From the electrophysiology work of Hubel and Wiesel 1 to cognitive activation paradigms in human neuroimag -ing 2, this approach to study brain function has been very successful. A simple example of this approach is a paradigm that requires subjects to open and close their eyes at fixed intervals (FIG. 1) . Modulation of the functional magnetic resonance imaging (fMRI) blood oxygen level dependent (BOLD) signal attributable to the experimental paradigm can be observed in distinct brain regions, such as the visual cortex, allowing one to relate brain topography to function. However, spontaneous modulation of the BOLD signal which cannot be attributed to the experimental paradigm or any other explicit input or output is also present. Because it has been viewed as ‚ noise ™ in task-response studies, this spontaneous component of the BOLD signal is usually minimized through averaging. This Review takes spontaneous brain activity as its focus. Although spontaneous activity has been studied both in animals and humans across many spatial and tem -poral scales 3,4 , this Review focuses specifically on slow (<0.1 Hz) fluctuations in the BOLD signal. Why should one be interested in the noise in the BOLD signal? There is both a theoretical and an empirical motivation. The theoretical motivation for studying spontaneous activity stems from an under -standing of brain energy metabolism. The resting human brain represents only 2% of total body mass but consumes 20% of the body™s energy, most of which is used to support ongoing neuronal signalling 5Œ9 . Task-related increases in neuronal metabolism are usually small (<5%) when compared with this large resting energy consumption 9. Therefore, most of our knowledge about brain function comes from studying a minor component of total brain activity. If we hope to understand how the brain operates, we must take into account the component that consumes most of the brain™s energy: spontaneous neuronal activity. The empirical motivation for studying spontaneous BOLD activity arose from the observation that spontaneous BOLD fluctuations measured in the left somatomo -tor cortex are specifically correlated with spontane -ous fluctuations in the right somatomotor cortex and with medial motor areas in the absence of overt motor behaviour 21 . This finding has since been replicated by several groups 10Œ15 (FIG. 2) .The observation that spon -taneous BOLD activity is not random noise, but is specifically organized in the resting human brain has generated a new avenue of neuroimaging research. These studies have provided insight into the functional topography of the brain, aided the evaluation of neuro- anatomical models, accounted for variability in evoked responses and human behaviour, and raised many interesting questions and challenges for future work. We begin this Review with a description of the cur -rent methods used to study spontaneous BOLD activity and the spatial and temporal properties of spontaneous BOLD fluctuations. We then examine the interaction of *Mallinckrodt Institute of Radiology, Washington University School of Medicine, 4525 Scott Avenue, St. Louis, Missouri 63110, USA. ⁄Departments of Neurology, Anatomy and Neurobiology and Biomedical Engineering, Washington University St. Louis, Missouri 63110, USA. e-mails: foxm@npg.wustl.edu; marc@npg.wustl.edu doi:10.1038/nrn2201 Blood oxygen level dependent signal (BOLD). Signal used by fMRI as a non-invasive but indirect measure of changes in neuronal activity. Noise Modulation in a measured signal that is unrelated to the effect of interest. Noise is usually minimized through averaging, allowing the effect of interest to be emphasized. Spontaneous fluctuations in brain activity observed with functional magnetic resonance imaging Michael D. Fox* and Marcus E. Raichle ⁄Abstract | The majority of functional neuroscience studies have focused on the brain™s response to a task or stimulus. However, the brain is very active even in the absence of explicit input or output. In this Article we review recent studies examining spontaneous fluctuations in the blood oxygen level dependent (BOLD) signal of functional magnetic resonance imaging as a potentially important and revealing manifestation of spontaneous neuronal activity. Although several challenges remain, these studies have provided insight into the intrinsic functional architecture of the brain, variability in behaviour and potential physiological correlates of neurological and psychiatric disease. REVIEWS 700 | SEP TEMB ER 2007 | V OL UME 8 www.nature.com/reviews/neuro
PAGE - 2 ============
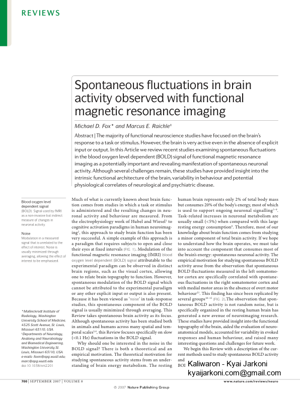
% BOLD changeŒ1Œ0.500501001502002500.511.52. 02. 53.0OpenOpenOpenOpenClosed Closed Closed Closed Open Œ Closed =Nature Reviews | Neuroscienc eTime (sec)Water phantom Glass sphere containing water that is used to study fMRI signal properties in a non- biological system. Linear regression Computation of a scaling factor such that multiplication of a regressor time course by this scaling factor will remove the greatest amount of variance when subtracted from a signal of interest. Voxel A volume element that is the smallest distinguishable, box- shaped part of a three- dimensional space. spontaneous activity with task conditions and address several important questions regarding how spontaneous BOLD activity should be interpreted. We briefly discuss what is known about the physiology of spontaneous BOLD activity and conclude with a discussion of areas for future advancement in the field. Methods for analysing spontaneous BOLD data Spontaneous neuronal activity refers to activity that is not attributable to specific inputs or outputs; it repre -sents neuronal activity that is intrinsically generated by the brain. As such, fMRI studies of spontaneous activity attempt to minimize changes in sensory input and refrain from requiring subjects to make responses or perform specific cognitive tasks. Most studies are con -ducted during continuous resting-state conditions such as fixation on a cross-hair or eyes-closed rest. Subjects are usually instructed simply to lie still in the scanner and refrain from falling asleep. After data acquisition, two important data analysis issues must be considered: how to account for non-neuronal noise and how to identify spatial patterns of spontaneous activity. Accounting for non-neuronal noise . An important differ -ence between studies of spontaneous activity and more traditional studies of task-evoked responses is that the latter usually involve averaging across many trials. This averaging eliminates noise and increases confidence that the effect being studied is not an artefact. In studies of spontaneous activity, the signal being analysed and interpreted is the noise that task-evoked studies seek to remove by averaging. A natural concern, therefore, is that spontaneous activity results are contaminated by or even due to an artefact, such as scanner instability or non-neuronal physiological fluctuations. Consistent with this concern, spontaneous BOLD fluctuations have been observed in a water phantom 16 and physiological fluctuations, such as cardiac or respiratory activity, account for a significant fraction of spontaneous BOLD variance in human data 17Œ20 . Fortunately, a large amount of work has gone into addressing this concern. One strategy to account for non-neuronal noise is to use a high sampling rate, which prevents aliasing of higher frequency cardiac or respiratory activity 11,12,21,22; however, this comes with the limitation of reduced spatial coverage. Alternatively, physiological parameters can be measured during BOLD acquisition and removed from the data through linear regression 18Œ20,23,24 . Finally, noise sources can be isolated from the BOLD data itself through techniques such as independent components analysis (ICA, see below) 25Œ27 , regressing out signals that are com -mon to all voxels (the global signal) 16,28,29 or signals from regions that are likely to have a relatively high degree of physiological artefact relative to the amount of neuronal activity, such as the ventricles or white matter 24,29 .In a sense, these strategies take the place of the aver -aging in task-evoked studies and attempt to ensure that spontaneous BOLD analyses are not simply interpreta -tions of non-neuronal noise. Thoughtful implementation allows the neurobiologically meaningful information in spontaneous BOLD data to be emphasized. Identifying spatial patterns . Techniques for identifying spatial patterns of coherent BOLD activity, an analysis often referred to as functional connectivity (BOX 1) , are also required. The simplest technique is to extract the BOLD time course from a region of interest (called a seed region) and determine the temporal correlation between this extracted signal and the time course from all other brain voxels (FIG. 2) . This approach is widely used owing to its inherent simplicity, sensitivity and ease of interpretation 10Œ14,24,29Œ36 . However, it has some disadvantages. The results are dependent on the a priori definition of a seed region, multiple systems cannot be studied simultaneously and the extracted waveform may not be a true independent variable when assessing statis -tical significance. In response to these limitations other more sophisticated techniques for analysing spontane -ous BOLD data have been proposed. Hierarchical clustering still requires a priori defini -tion of seed regions 37Œ40 . However, instead of extracting the time course from just one seed region, the time Figure 1 | Traditional fMRI analysis and BOLD noise. Unaveraged blood oxygen level dependent (BOLD) time course (magenta) from a region in the primary visual cortex during a simple task paradigm that requires subjects to open and close their eyes. The paradigm is shown in blue (delayed to account for the haemodynamic response). Traditional functional magnetic resonance imaging (fMRI) analysis involves correlating BOLD data with a stimulation time-course across multiple blocks. This in effect averages across each condition and performs a subtraction, minimizing ‚noise™ in the BOLD signal and highlighting regions that are modulated by the task paradigm. In this case, subtraction of the eyes-closed condition from the eyes-open condition identifies a BOLD signal intensity difference in the primary visual cortex (shown on the right). REVIEWS NAT URE REV IEWS | NEU RO SC IENCE V OL UME 8 | SEP TEMB ER 2007 | 701
PAGE - 3 ============
Nature Reviews | Neuroscienc eŒ20Œ15Œ10Œ505 101520Œ1.5Œ1.0Œ0.50.00.51.01.52. 005 0100150200250300LSMCRSMCS2PThCe rTime (sec)% BOLD changeabccourses from many seed regions are obtained and a correlation matrix is constructed. A clustering algo -rithm is then used to determine which regions are most closely related and which regions are more dis -tantly related. This information enables the creation of a hierarchical tree or topological map, which is useful for visualizing the relationships between large numbers of regions. ICA is perhaps the second most popular technique for analysing spontaneous BOLD data 22,26,27,41Œ43 . This approach does not require a priori definition of seed regions. Instead, sophisticated algorithms analyse the entire BOLD data set and decompose it into components that are maximally independent in a statistical sense. Each component is associated with a spatial map. Some maps reflect noise components whereas others reflect neuro-anatomical systems. Because this technique is data driven and automatically isolates sources of noise, it holds tremendous promise and its use is increasing. However, there are still several challenges. First, results are highly dependent on the number of components one asks the algorithm to produce. Second, the user must determine which components reflect noise and which components look like neuro-anatomical systems, intro -ducing a priori criteria for system selection. Finally, the sophistication of the algorithm introduces interpretive complexities; for example, if the magnitude of a spatial component is reduced in Alzheimer™s disease 44 does this relate to a reduction in temporal coherence, a reduction in fluctuation magnitude or a change in the relationship between components? In summary, there are several approaches for dealing with non-neuronal noise in spontaneous BOLD data and several techniques for identifying patterns of coherent activity 41,44Œ46 . We have restricted our Review to the three most common techniques for identifying spatial pat -terns, although many others have been proposed 47Œ49 . Future advances will undoubtedly come from further technique development and combining multiple tech -niques within the same study 50 . Although different techniques each have strengths and weaknesses, they converge on a similar finding: neuro-anatomical sys -tems in the human brain can be identified on the basis of correlation patterns in spontaneous BOLD activity. Properties of spontaneous BOLD activity Spatial topography and coherence. The observation that the somatomotor system is coherent in its spontaneous activity has been replicated many times 10Œ15,21 (FIG. 2) . By placing seed regions in additional brain areas, many other neuro-anatomical systems have been shown to be coher -ent in their spontaneous activity, including visual 10,11 , auditory 10 , task-negative/default mode 29Œ32 , hippocampus or episodic memory 24,33 , language 10,34 , dorsal attention 32,35 and ventral attention systems 35. Many of these systems have also been identified using hierarchical clustering 37,38 and ICA 22,26,27,41Œ43 . A consistent finding is that regions with similar functionality Š that is, regions that are simi -larly modulated by various task paradigms Š tend to be correlated in their spontaneous BOLD activity. Interestingly, regions with apparently opposing functionality have been found to be negatively corre -lated or anticorrelated in their spontaneous activity 29Œ31 (FIG. 3). Specifically, regions routinely exhibiting activity increases in response to attention demanding cognitive tasks 51 are anticorrelated with a set of regions routinely exhibiting activity decreases 52 . Although further work is needed to understand the role of global normalization in these anticorrelations, this finding suggests that complex inter-system relationships revealed by task paradigms are reflected in patterns of ongoing spontaneous activity. Given that correlation patterns of spontaneous activity reflect functional topography, these patterns could be used to predict the task-response properties of brain regions. For example, the degree to which a subject™s left somatomotor cortex resting-state correlation map is lat -eralized to the left hemisphere predicts how lateralized that subject™s activation map will be in response to right- hand finger tapping 15. The finding that a region is cor -related with the hippocampus during the resting state is predictive of that region™s response to episodic memory tasks 33 . Interestingly, most memory tasks implicate only a subset of regions 53,54 , whereas the hippocampal formation resting-state correlation map reveals the full distribution of memory-related regions assessed across multiple experiments 33 . Patterns of spontaneous activ -ity could thus serve as a functional localizer, providing a priori hypotheses about the way in which the brain will respond across a wide variety of task conditions. In addition to predicting how brain regions will respond to a task, spatial patterns of spontaneous activity may also predict an individual™s task performance or Figure 2 | Generation of resting-state correlation maps. a | Seed region in the left somatomotor cortex (LSMC) is shown in yellow. b | Time course of spontaneous blood oxygen level dependent (BOLD) activity recorded during resting fixation and extracted from the seed region. c | Statistical z-score map showing voxels that are significantly correlated with the extracted time course. Their significance was assessed using a random effects analysis across a population of ten subjects. In addition to correlations with the right somatomotor cortex (RSMC) and medial motor areas, correlations are observed with the secondary somatosensory association cortex (S2), the posterior nuclei of the thalamus (Th), putamen (P) and cerebellum (Cer). REVIEWS 702 | SEP TEMB ER 2007 | V OL UME 8 www.nature.com/reviews/neuro
PAGE - 4 ============
Power spectral density function The distribution of power at each frequency in a time- varying signal, generally displayed with power on the y-axis and frequency along the x-axis. Electroencephalography (EEG). A technique used to measure neural activity by monitoring electrical signals from the brain that reach the scalp. EEG has good temporal resolution but relatively poor spatial resolution. Magnetoencephalography (MEG). A non-invasive technique that allows the detection of the changing magnetic fields that are associated with brain activity on a timescale of milliseconds. Local field potential Electrical fields recorded from microelectrodes in the brain that are thought to reflect the weighted average of input signals on the dendrites and cell bodies of neurons in the vicinity of the electrode. Hypercapnia Situation occurring when the amount of dissolved carbon dioxide in blood rises above its physiological mean of about 40 Torr. behaviour. Specifically, individual differences in the spatial topography of spontaneous activity have been shown to correspond to individual differences in pre- scan anxiety 50 and performance on working memory tasks 50,55 . The idea that an individual™s spontaneous brain activity may predict that person™s aptitude for different tasks, intelligence or personality promises to be a major focus for future research. Finally, correlation patterns of spontaneous activity can be used to further our understanding of neuro- anatomical models developed on the basis of task- activation studies 35,40 . For example, a model of atten -tion consisting of two interacting neuro-anatomical systems, a dorsal and ventral attention system, has been proposed 51 . Although this model was consistent with a number of task-related imaging results, it was unclear if task-related manipulations of attention were necessary to distinguish the two systems or which regions might mediate the interaction between them. Recent work has distinguished these two attention sys -tems on the basis of resting-state correlation patterns and identified potential regions of interaction in the frontal lobe 35 . Furthermore, disruption of this intrinsic organization corresponds to attentional deficits follow -ing stroke and normalizes with functional recovery 56 . Given the large number of neuro-anatomical models that have been developed or studied using task-activa -tion paradigms, it is likely that many models could benefit from the examination of correlation patterns in spontaneous activity. In summary, much is now known about the topog -raphy and coherence of spontaneous BOLD fluctua -tions. The correlation structure of spontaneous activity can provide insight into the fundamental functional architecture of the human brain. Temporal properties . It is clear that the spatial properties of spontaneous BOLD activity distinguish it from random noise but, interestingly, so do the temporal properties. Specifically, random noise (also called white noise) can be characterized by a flat power spectral density function , mean -ing that all frequencies are present to an equal degree. By contrast, spontaneous BOLD follows a 1/f distribution, meaning that there is increasing power at lower frequen -cies 16,57 . These lower frequencies are represented in a specific fashion such that the slope of the power spectral density function will be close to Œ1 when plotted on a log- log plot. This 1/f distribution has also been observed in studies of spontaneous electroencephalography (EE G) 58,59 , magnetoencephalography (M EG) 58 , local field potential recordings 60 and human behavioural variability 61Œ63 .An important question is which frequencies in this 1/f distribution are responsible for the spatially specific correlation patterns seen in spontaneous BOLD. A study focused on this question showed that only frequencies below 0.1 Hz contribute to regionally specific BOLD cor -relations, with faster frequencies relating to cardiac or respiratory factors 12 . Based on this finding, the majority of spontaneous BOLD studies low-pass filter data at a cut-off of 0.08 or 0.1 Hz. An interesting question that has not been systematically investigated is whether there is a lower limit to the frequencies contributing to spatially specific correlations. It is also not known if BOLD con -tinues to exhibit a 1/f frequency distribution in the lower frequency range. Paradigms with longer acquisitions are needed to answer these questions. Beyond the frequency distribution, other types of temporal information may prove interesting. For exam -ple, temporal lags between spontaneous BOLD fluc -tuations in different regions forming a coherent spatial pattern may inform us about causality or the direction of influence 64 . Similarly, it would be interesting to know if and how spontaneous BOLD correlations change over time. Do spontaneous BOLD fluctuations synchronize and desynchronize throughout the resting state similar to the transient synchrony often observed in animal work 4 or are they temporally consistent? Magnitude of spontaneous BOLD fluctuations. Spontaneous fluctuations in the BOLD signal can be of equal magnitude to brain responses observed in response to tasks or stimuli 14,65 . Currently, it is unclear how the magnitude of spontaneous BOLD fluctuations should be interpreted, however, this question is beginning to be addressed. The magnitude and coherence of spontane -ous BOLD fluctuations are globally decreased with hyper -capnia 66 and in subjects under the influence of cocaine 67 , isoflurane 36 or sevoflurane anaesthesia 68 , but globally increased with midazolam-induced sedation 69 . The mag -nitude of spontaneous BOLD fluctuations increases in the visual cortex when resting with eyes open compared with resting with eyes closed 70 and decreases in the default sys -tem during performance of a working memory task com -pared with rest 73 . The relationship between the magnitude of spontaneous BOLD fluctuations and regional metabolic parameters, such as glucose or oxygen consumption, is a promising avenue for future work. Box 1 | Functional connectivity A term that appears frequently in the literature when discussing correlations in spontaneous blood oxygen level dependent (BOLD) fluctuations is ‚functional connectivity™ which may refer to any study examining inter-regional correlations in neuronal variability 146,147 . This applies to both resting-state and task-state studies, and can refer to correlations across subjects, runs, blocks, trials or individual BOLD time points, an ambiguity that can become confusing 48,147 . This Review is focused specifically on functional connectivity assessed across individual BOLD time points during resting conditions, however there is an extensive body of work involving other types of functional connectivity, which has produced many interesting results. For example, studies have related inter-regional correlations during task performance to behaviour 148,149 , genetics 150 and even personality 150 .An important question is whether the various types of task-state functional connectivity and resting-state functional connectivity measure the same or different phenomena. As spontaneous activity continues during task conditions, a correlation during task performance probably represents some combination of underlying spontaneous activity and traditional task-related responses related to stimulus input, behavioural output or attention. One way to address this question is to determine if the effects observed in studies of task-state functional connectivity are also present in patterns of spontaneous activity. For example, it has been shown that the correlation between language areas in the brain during a language task relates to reading ability 149 . The correlation between these same areas during rest showed some relation to reading ability, but it was not significant. Further studies of this sort are needed to better understand the relationship between the extensive literature on functional connectivity and correlations in spontaneous BOLD activity during the resting state. REVIEWS NAT URE REV IEWS | NEU RO SC IENCE V OL UME 8 | SEP TEMB ER 2007 | 703
PAGE - 5 ============
Nature Reviews | Neuroscienc eŒ10.00.010.0FEFIPSLPPCCMTMPFSpontaneous activity during task conditions The influence of spontaneous activity on task-related responses and behaviour. Up to this point, we have discussed spontaneous BOLD activity primarily during resting-state conditions. However, spontaneous activity continues during task performance, showing a similar neuro-anatomical distribution to that observed at rest 14, 71-73 . What is the effect of this continuing spontaneous activ -ity on task-related neuronal responses and behaviour? Using voltage-sensitive dye imaging in anaesthetized cats, it was shown that the spontaneous state of the system at the time of stimulus presentation determines the neuronal response to the stimulus 74,75 . Recently, a similar finding has been reported in awake behaving humans, showing that coherent spontaneous activ -ity accounts for variability in event-related BOLD responses 14 (FIG. 4) . Specifically, it was shown that ongoing spontaneous activity, as measured in the right somatomotor cortex, can account for variability in left somatomotor cortex BOLD responses following right-handed button presses. These studies suggest that measured neuronal responses represent an approxi -mately linear superposition of task-evoked neuronal activity and ongoing spontaneous activity. Furthermore, it may be possible to dramatically improve the signal- to-noise ratio in event-related BOLD studies by correcting for underlying spontaneous activity 14 .These results are of particular interest when one considers the large number of studies showing that variability in measured BOLD responses correlates with variability in human behaviour 76-82 . If spontaneous activity accounts for much of the variability in BOLD responses and variability in BOLD responses is corre -lated with behaviour, then we are left with the possibility that the coherent spontaneous activity observed during the resting state contributes to inter-trial variability in human behaviour. This hypothesis is made more salient by the observation that many types of behavioural vari -ability follow a 1/f frequency distribution similar to that of spontaneous BOLD 61Œ63 .We recently tested this hypothesis and found that spontaneous fluctuations within the human somat omotor system are correlated with trial-to-trial variability in the force of a button press 57 . When the spontaneous activity in the somatomotor system is low, subjects press the button a bit harder than when the spontaneous activity is high. The finding that spontaneous BOLD fluctuations account for inter-trial variability in behaviour within subjects complements the previously cited studies of inter-subject variability 50,55,56 . Together, these results highlight the functional importance of spontaneous BOLD activity by showing a direct correspondence with variability in human behaviour. The influence of task conditions on spontaneous activity. Although it appears that the basic correlation structure of spontaneous activity continues during task perfor -mance some changes may occur. The idea that neuronal networks re-organize in the context of different task con -ditions has a strong precedent 83 and animal studies have shown changes in neuronal synchrony depending on the context of the task 4,84 . Many groups have compared patterns of correlated BOLD activity during rest with those obtained during task performance or stimulus presentation 34,65,72,73,85-90 . The general consensus of these studies is that the correlation between two regions that are similarly activated by the task or stimulus increases during task conditions, whereas the correlation between other regions is decreased. There are two potential explanations for the changes in regional correlations observed during task performance. First, there may be a true re-organization involving facilitation and depression of synapses 83 , leading to changes in the correlation structure of spontaneous activity. A second possibility is that the correlation struc -ture of spontaneous activity remains constant between task and rest, and that the observed changes in correla -tions are due to a simple superposition of spontaneous and task-evoked activity 14 . A study in the somatomotor system supports this second possibility, showing that, after correction for evoked activity, the correlation in the underlying spontaneous activity remains the same 72 . The degree to which the correlation structure of spontane -ous activity changes under task conditions remains an important but unanswered question and may require improved techniques for distinguishing concurrent spontaneous and task-related activity. The studies discussed above have focused on changes in the correlation structure of spontaneous activity during task performance, but other studies have compared cor -relations before and after task performance 91,92 . One study found reduced cross-hemisphere motor correlations after muscle fatigue 92 , whereas another study found no consis -tent group differences after performance of a cognitive task 91 . Similarly, the correlation structure of brief rest -ing periods interspersed with task performance has also been studied and found to be similar to results obtained with continuous resting data 93 . These experimental approaches are important as observed changes in correlations are not complicated by concurrent task-evoked activity. Additional studies in this area Figure 3 | Intrinsically defined anticorrelated networks in the human brain. Positive nodes, shown in warm colours, are significantly correlated with seed regions involved in focused attention and working memory (task-positive seeds) and significantly anticorrelated with seed regions that are routinely de-activated during attention- demanding cognitive tasks (task-negative seeds). Negative nodes, shown in cool colours, are significantly correlated with task-negative seeds and significantly anticorrelated with task-positive seeds. The task-positive seeds are the intra-parietal sulcus (IPS), frontal eye field (FEF) and middle temporal (MT) area . The task-negative seeds are the posterior cingulate/precuneus (PCC), lateral parietal cortex (LP) and medial prefrontal cortex (MPF). Modified, with permission, from REF. 29 (2005) National Academy of Sciences. REVIEWS 704 | SEP TEMB ER 2007 | V OL UME 8 www.nature.com/reviews/neuro
PAGE - 6 ============
Nature Reviews | Neuroscienc eBOLD change (%)Time (sec)Œ1.00Œ0.500.000.501.001.502. 00Œ149 1419BOLD change (%)BOLD change (%)Time (sec)Œ1.00Œ0.500.000.501.001.502. 00Œ149 1419Time (sec)Œ1.00Œ0.500.000.501.001.502. 00Œ149 1419Callosal agenesis A rare birth defect in which the corpus callosum fails to develop. Diffusion tensor imaging (DTI). An MRI imaging technique that takes advantage of the restricted diffusion of water through myelinated nerve fibres in the brain to map the anatomical connectivity between brain areas. Mentation Mental activities of which a subject is consciously aware. Mental imagery The conscious recollection of an object or a scene in its absence. may provide insight into the origin of the spontaneous fluctuations and the neuronal correlates of experience- based learning 94 .Interpreting spontaneous BOLD activity Do spontaneous BOLD correlations reflect anatomical connections? Given the specific neuro-anatomical orga -nization of spontaneous BOLD activity, this is a natural question. Only a few studies have directly addressed this issue, probably due in large part to the difficulty of directly assessing anatomical connectivity in humans. A study of patients with callosal agenesis found reduced cross- hemisphere correlations suggesting that reduced anatomical connectivity is related to a reduction in spontaneous BOLD correlations 95 . Additional studies on patients with more specific abnormalities in brain connectivity, such as callosotomy, are warranted. Other studies have examined the relationship between sponta -neous BOLD correlations and anatomical connectivity using diffusion tensor imaging (DTI) 22,96 . These studies suggest some relationship between the two factors, but were limited either by not having spontaneous BOLD and DTI data from the same subjects 22 or by restricting the analysis to adjacent gyri 96 . Further studies combining DTI and spontaneous BOLD are needed. Further insight into the relationship between sponta -neous BOLD correlations and anatomy may come from an experimental system in which anatomical connectivity can be more easily assessed and manipulated Š that is, in an animal model. Recently, spontaneous BOLD correlation patterns have been studied in anaesthetized macaque monkeys and the results were compared with established anatomical connections seen by tract tracing 36 (FIG. 5) . Although there is a correspondence, there are also BOLD correlations between regions in the monkey visual system that have no direct anatomi -cal connections, suggesting that polysynaptic pathways must also have a role 36 . Future studies in monkeys that examine BOLD correlations and tract tracing within the same animal or in which specific fibre tracts have been lesioned could be informative. Is spontaneous BOLD activity due to unconstrained tasks? A critical question regarding the interpretation of spontaneous BOLD activity is the extent to which it is due to unconstrained behaviour or conscious mentation . Undoubtedly, when subjects are asked to rest quietly in the scanner they perform mental ‚tasks™ that result in changes in neuronal activity 97 . If these uncontrolled tasks are responsible for the coherence patterns observed in spontaneous BOLD activity, then resting-state BOLD studies may be no more interesting than poorly controlled task-activation studies. Although spontaneous behaviour is likely to contribute to resting-state BOLD fluctuations, it is unlikely to be the predominant source for several reasons. First, similar topography of BOLD correlations can be observed across different behavioural states, including different resting conditions 29,35 , task performance 71-73 , sleep 98,99 and even anaesthesia 27,36,68 (FIG. 5) . Second, coherent spontaneous fluctuations have been observed within systems associ -ated with specific behaviour even in the absence of that behaviour 14,21,72 (FIG. 2) . Third, task-evoked activity due to a specific behaviour seems to be distinct from and super -imposed on underlying spontaneous activity 14,72 (FIG. 4) . Fourth, spontaneous cognition, such as mental imagery , results in patterns of neuronal activity in visual regions that are distinct from patterns observed in spontaneous activity 65 . Finally, coherent spontaneous fluctuations are present continuously within a large number of Figure 4 | Coherent spontaneous fluctuations account for variability in event-related BOLD responses. a | Raw left somatomotor cortex event-related blood oxygen level dependent (BOLD) responses for 18 right-handed button presses from a single subject. b | The corresponding activity in the right somatomotor cortex during each button press can be used as an approximation of the ongoing spontaneous activity in the left somatomotor cortex. c | Left somatomotor cortex responses after subtraction of spontaneous fluctuations measured in the right somatomotor cortex show a decrease in variance and an increase in signal-to-noise ratio. The thick orange line in each graph represents the best fit gamma function to all data points. Modified, with permission, from Nature Neurosci . REF. 14 (2006) Macmillan Publishers Ltd .REVIEWS NAT URE REV IEWS | NEU RO SC IENCE V OL UME 8 | SEP TEMB ER 2007 | 705
156 KB – 12 Pages