by PVO BHP — Results of using this advanced controller on a ball mill circuit operation in a throughput-limited ball mills and Semi-autogenous grinding (SAG) mills.
127 KB – 7 Pages
PAGE – 1 ============
Advanced Controller for Grinding Mills: Results from a Ball Mill Circuit in a Copper Concentrator Anoop Mathur, Sujit Gaikwad, Honeywell Technology Center Robert Rodgers, Nels Gagnon BHP, Pinto Valley Operations Pierre Rousseau Honeywell HiSpec Abstr act We describe an advanced multivariable controller for grinding mills which will, in spite of the severe disturbances in a mining environment, significantly improve throughput while maintaining product particle size. Some grinding operations are subjected to power excursions or spillage (such as in Semi – Autogenous and Autogenous mills), uncertainty in measurement, low ore bin, centrifuging and so on. The controller uses specific algorithms to detect these abnormal conditions and reconfigure itself on – li ne to provide the best performance. Results of using this advanced controller on a ball mill circuit operation in a copper concentrator are presented. The controller stabilized the mill operation and resulted in a 4.18% throughput increase in ground ore that is finer than the desirable size. INTRODUCTION In the past fifteen years, model – based control techniques have been successfully used in the process industry. These multivariable controllers stabilize operations by explicitly designing for process co nstraints such as deadtimes, nonlinearities, and dynamic interactions. The controllers’ robustness (that is, its ability to stabilize operations under various operating conditions) and ease – of – use have contributed to the widespread acceptance at the operations level. Because of this ability, the processes are operated closer to constraints, which can increase throughput at specified product quality or produce product at the best economic value. Payback periods from as little as one month to a typical six months have been reported. It is these economic and robustness factors that have contributed to the enormous success of the multivariable controllers, especially in the petrochemical industries. Mineral processing facilities involve a large number of dynamically complex unit operations, with comminution being a typical example. Recent application of the multivariable control techniques for grinding has shown significant improvement in process stability with a strong return on investment for throughput – li mited ball mills and Semi – autogenous grinding (SAG) mills. Given this large operational benefit, several mineral processing facilities are currently evaluating and implementing these strategies. The key to successful acceptance in this industry will be the ability of these controllers to handle unusual process upsets and to recognize operation realities such as: A change in quality of ore type and ore size (F80). These types of changes can lead to process upsets such as mill spills and/or power excursi etc. The constant need to adjust plant operation objectives because of frequent problems with equipment upstream (such as primary crushers) or downstream (such as performance of flotation, or regrind mills), with availability and maintenance of critical sensors (such as pulp density, particle size measurements), or with the hardness/softness of ore. These adjustments can shift the trade – off between the desired particle size distribution and throughput and cha nge the operational constraints for the grinding mill.
PAGE – 2 ============
To be successfully accepted, multivariable controllers in mineral processing must provide easy or automatic reconfiguration to accommodate operational situations and to keep the process stable and operating at or near optimum. SmartGrind, developed at Honeywell, is such a controller. It handles these and other situations unique to plants in different regions of the world (Luse, Mathur et al, 1997). It combines the powerful model – based controller R MPCT with the advanced techniques based on neural networks, or rules, to provide the best performance guaranteed by the core RMPCT controller under different operating scenarios. Results at a copper refinery indicate an improvement of 4.18% increase in throughput over and above the existing advanced intuitive logic based controller on site. In many plants, benefits of 2% to 10% can be expected which is significant in mineral processing. Typically, a 1% improvement in throughput of usable product repres ents over a million dollar increase in revenue per site. Thus, any technique even a rule – based expert control system can show improvement and pay for itself in a short period when compared to a PID or manual operation. However, the mineral industry should look at the experience of the petrochemical industry in evaluating the life cycle cost and the future potential of systematic expansion to plant wide optimization offered by model – based techniques. MILL CONTROL: GENERA L CONCEPTS The problem of des igning controllers for efficient control of grinding mills has been studied in the literature, but has not seen significant application in actual mineral processing plants (Jerez et al 1985, Ciprano et al 1989, Rajamani et al 1991). The first successfully implemented multivariable process control (MPC) is described for a SAG mill circuit in a bauxite processing refinery at Wagerup, Australia (Refs: Gopinath, Mathur et al, 1995 and Le Page, Freeman et al 1996, Luse, Mathur et al 1997). The MPC controller p resented in this paper is perhaps the first successful implementation of MPC for ball mills described in the literature. Current MPC software has its roots in a set of heuristic, model – based control algorithms proposed and implemented within the process industry in the late 1970s (Richalet et al, 1978; Cutler and Ramaker, 1980). Subsequent to that, many important developments in MPC formulation enabled the current robust multivariable design that can handle input and output constraints and deadtime and can incorporate optimization. In this way, it provides a powerful control technique that is ideally suited for process control applications. The methodology in a general MPC algorithm is as follows: A model (generally, a dynamic interaction model identified on – line) of the process is run in parallel with the plant and subjected to the same inputs as the plant. The model is used to compute a predicted output trajectory over a certain number of future points An optimizatio n problem is then set up to minimize the deviation of this predicted output from a desired trajectory into the future. The decision variables are computed control moves. The first control move is implemented on the plant and model, and the process is repeated. This sets up the so – explicitly in the control calculation when the optimization step is set up, subject to the satisfaction of these constraints. All MPC methods share this basic philosophy; the differences in methods of prediction and error minimization are purely algorithmic. The controller product from Honeywell is a robust multivariable predictive controller (RMPCT). SmartGrind uses RMPCT as the core controller with smart modules that detect non – normal situations and reconfigure the RMPCT. Figure 1 shows a block diagram of the SmartGrind controller.
PAGE – 3 ============
Figure 1. Block diagram of Total Plant TM SmartGrind multivariable predictive controller MILL CONTROL: BALL MILL CONTROL EX AMPLE Process Description The copper concentrator in Pinto Valley, Arizona processes a 0.4% grade copper ore from a nearby open pit mine. The unit operations consisting of crushing, grinding, and flotation process about 65,000 tons of ore per day in six overflow ball mills. The concentrate is transported to a smelter a few miles away. The crushed ore from primary and secondary ores is conveyed into bins. The ore from the bins is fed into the ball mill using a conveyor belt. The ball mill grinding circuit is illustrated in Figure 2. Figure 2. Ball Mill Grinding Circuit The ball mill is in closed circuit with a sump and three cyclone classifiers. The ore and trim water are added to the ball mill and the outflow from the ball mill goes to a sump where additional water is added. The slurry from the ball mill is pumped out of a sump into two cyclone separators. The underflow from the cyclone is returned to the ball mill. Balls are added periodically to the mill on a per shift basis or when the power draw drops below a preset value at nominal operating conditions. SmartGrind was installed on Mill No.5 and its performance was compared to the neighboring Mills 3 and 4. The following measurements were made: ore feed rate, trim water flow, sump water flow, cyclone feed slurry specific gravity, power draw, particle size measurement (per cent passing +65 mesh), sump level, and cyclone pressure. In addition, periodic lab measurements are made of ore feed size, product size
PAGE – 4 ============
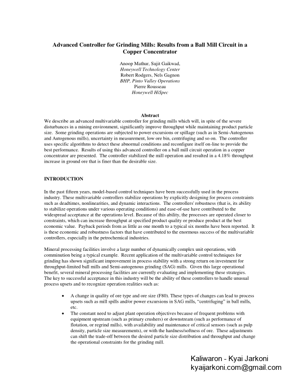
distribution, and chemical analysis to the flotation. On mills other than No.5, automatic PID controls with operator supervision controlled the mills. On these mills, trim water flow is in ratio to the ore feed rate and the sump level is controlled by manipulating sump water addition. An intuitive – logic based (constrained – model based) controller was installed to adjust the trim water ratio by monitoring PSM, ore feed rate, and power draw. On Mill 5 we disabled this constraint – based model controller and used SmartGrind wit h the Controlled Variables (CVs) and Manipulated Variables (MVs), shown in Table 1. TABLE 1. Control and Manipulated Variables: Control Variables Manipulated Variables Particle Size Ore Feed Rate Sump Level Sump Water Addition Mill % Solids Trim Water Addition Power Draw Cyclone feed density Cyclone feed flow rate Circulation Load % System Identification Figure 3. Input – Output Model: Results of System Identification of Ball Mill
PAGE – 5 ============
Step tests identify the input – output dynamic model of the plant. Figure 3 shows the model at nominal operating point representing the dynamic interactions of controlled variables to the three manipulated variables: ore feed rate, trim water flow and sump water flow. The first row shows the response of particle size measurement (PSM) to the manipulated variables. Reducing ore feed rate, or adding water either to the mill or to the sump reduces the PSM as expected. However, the gain with trim water is higher than with the sump water. This may be because of the water is added to the sump the PSM response is almost immediate, which may be one of the reason why operators tend to use sump water to counter disturbances to PSM. Control Performance Results Figure 4 shows the performance of the SmartGrind controller. Figure 4. . SmartGrind controller on at 9:15am. Feed rate increased from 465 tph to 475 tph and PSM decreased. Response to Ore type Change at 9:40 am. The SmartGrind controller was switched on at 9:12am on this day. Notice that the controller immediately increased the feed rate and trim water, resulting in a decrease in PSM and increase in throughput. At about 9:35am there was an ore type change (a disturbance), the controller responded by increasing the trim water addition. The sump water addition decreased slightly in order to maintain the sump level. A higher weighting on the feed rate prevented the controller from using this manipul ated variable to counter short term disturbances to PSM. It was deemed better to take short term variations in PSM and keep the throughput steady and high. Table 2 shows a production analysis comparison for Mill 5 with SmartGrind with that of Mill 4 controlled with the constrained model based controller under operator supervision. Both the mills processed the same number of tons of material per hour; however, the PSM with Mill 5 was smaller than for Mill 4. The total
PAGE – 6 ============
floatable tons per hour (productio n rate of 65 or smaller mesh) increased by 4.83%. Also, the specific power consumption decreased by 1.2%. TABLE 2: Results from 65 hour SmartGrind control comparison (10/9/97 – 10/12/97) Variable Mill 5 Mill 4 Difference % change – 65 mesh , tph 360 344 16.6 4.83 Ore Feed Rate, tph 476 477 – 0.9 – 0.19 PSM, % passing +65 mesh 24.3 27.9 – 3.6 – 13.0 Power, kW 3233 3271 – 38 – 1.2 Circulating load, % 527 485 41 8.5 Similar results calculated with data in January showed a increase of 2% in production rate . ESTIMATED BENEFITS Each grinding circuit has its own control issues and objectives. Some are throughput limited, some have spillage problems or power excursions, and some have many types of ore with different optimum load site to site. To generalize, it is typical to realize a throughput increase of 2% or more by applying this control scheme. These throughputs can result from a new maximum con straint on throughput, a reduction of the standard deviation of average throughput, an avoidance of downtime through stable controls or a combination of all of these. Furthermore, the tuning and maintenance requirements for traditional controls are alleviated, pushing constraints is automated, and the mill operators operate their grinding circuits with an economic objective rather than to a particular setpoint. SmartGrind is also beneficial to mills that are not throughput limited. By using neural netwo rks and multivariable predictive control schemes, these mills can grind ore to a smaller range of sizes and reduce their overall power consumption, increasing recovery and reducing power costs. SmartGrind can reduce the standard deviation of the ore size range by 50%, increasing recovery significantly. individual mills. In this ball mill example, we calculated that by using SmartGrind, a throughput increase of 4.18% of for the desired product ( smaller than +65 mesh particle) was realized in October 1997. This increase is generally attributable to increased availability of the mill and to the way the multivariable controller manipulated water addition to the mill and to the sump. The local control philosophy is to add water at a specific ratio to the ore feed rate and let sump level be controlled by water addition to the sump. The dynamics of the plant indicated that the water addition to the mill should be as high as possible. Over time, the operators learned this and began to control the mills under their supervision with a higher ratio of water to ore feed rate than used before. Thus, performance data collected in December 1997 showed an increase in throughput of 2% when the mill was controlled with SmartGrind rather than under operator supervision. The benefit of 2% increase in throughput translates to an estimated increase in revenue of over $2.5 million per year for the site. CONCLUSIONS To be successfully accepted, multivariable controllers, in mineral processing must provide easy or automatic reconfiguration to accommodate severe disturbances, such as low ore bin due to upstream problems with crushers or downstream problems with flotation cells, in order to keep the process stable and
127 KB – 7 Pages