by M Irannajad · 2009 · Cited by 4 — KEY WORDS: Air separators, Cement size classification, Classification simulation, Air separators modeling, ASSIM. INTRODUCTION. Grinding process is the most
109 KB – 8 Pages
PAGE – 1 ============
Iran. J. Chem. Chem. Eng. Vol. 28, No. 4, 2009 71 Computer Simulation of Particle Size Classification in Air Separators Irannajad, Mahdi*; Rashidi, Samira Faculty of Mining, Metallurgical and Petroleum Engi neering, Amirkabir University of Technology, P.O.Box 1591634311, Tehran, I.R. IRAN Farzanegan, Akbar Department of Mining, Faculty of Engineering, Unive rsity of Kashan, P.O.Box 8731751167, Kashan, I.R. IRAN ABSTRACT: Cement powder size classification efficiency signi ficantly affects quality of final product and extent of energy consumption in clinker grinding circuits. Static and dynamic or high efficiency air separators are being used widely in closed circuit with multi-compartment tube ball mills, High Pressure Grinding Rolls (HPGR) and more recently Vertical Roller Mills (VRM) units in cement plants to classify comminuted clinker par ticles at finish grinding stage. Therefore, simulation of air separators is of critical importa nce in order to provide tools that can assist cemen t plants engineers in their routine clinker grinding circuit optimization efforts. In this paper, Air Separator Simulator (ASSIM), a newly developed simu lator implemented in VBŽ which provides a user-friendly process analysis and optimization env ironment will be introduced. First, a review of mathematical modeling of cyclone separators is pres ented. Then, the details of ASSIM and the results of its testing using industrial data from J . K. White Cement Works plant will be discussed. The simulator is mainly based on the Whiten functio n to model air separators and predicts fine and coarse output streams particle size distributions a nd flow rates. ASSIM performance was verified and validated by comparing its outputs with measure d data collected around an operating air separator. Preliminary software tests indicate the accuracy and precision of the developed code in predicting various properties of output streams as sum of least squares between predicted results and actual data is less than 0.01. KEY WORDS: Air separators, Cement size classification, Classi fication simulation, Air separators modeling, ASSIM . INTRODUCTION Grinding process is the most energy-consuming operation in cement production. About 30 % of the total electrical energy required to produce one tone of cement product is used in raw material preparation and 40 % is used in clinker finish grinding [1]. There is no do ubt that air separators installed and operated in dry clinker grinding * To whom correspondence should be addressed. + E-mail: iranajad@aut.ac.ir 1021-9986/09/4/9 8/$/2.80
PAGE – 2 ============
Iran. J. Chem. Chem. Eng. Irannajad, M., et al. Vol. 28, No. 4, 2009 72 circuits have strong impact on circuit capacity, en ergy consumption and quality of final product. Applying effective strategies to optimize operating paramete rs of air separators such as percent of feed solids in th e air, rotor speed and percent of fan opening is of critic al importance if a more efficient cement grinding oper ation is sought. In the past several decades, numerous re search studies have been carried out to improve grinding a nd classification performances by introducing accurate and well-proven mathematical models. Zhang published the results of first attempts to use a new empirical fu nction to model efficiency curves of air separators used in c ement industry [5]. In recent years, Benzer and his colleagues have done a number of research projects to simulate cement grinding circuits. They used Whiten model to simulate air separators which resulted in accurate predic- tions of fine and coarse streams particle size dist ributions [6-8]. Although, most of these studies are done in the field of static simulation by introducing different models, studies on dynamic simulation essential for describ ing processes in some devices are in progress [9]. Tremendous progress in computer hardware and software technologies have made it possible that po werful commercial software such as, JKSimMetŽ, MODSIMŽ, USIM PAC TM to be developed as off-line mineral processing optimization tools. Authors also have developed a number of dedicated software tools incl uding BMCS, NGOTC, BFDS and COMSIM [2-4] mainly for ball milling circuit simulation. Direct application s of these softwares to optimize cement clinker grinding circuits is faced with some limitations due to the special models and simulation structures required for descr ibing multi-compartment tube ball mills and air separator devices used in cement production plants. Presently , JKSimMet TM incorporates air separator models which are required for simulation of cement clinker grinding circuits. In this paper, the results of a literature review o n mathematical modeling of air separators and develop ment of a new software, ASSIM, is reported. Three best k nown modeling techniques are first introduced. Then, the Whiten model used in developing ASSIM is discussed in details and compared with other similar models. ASS IM relies on capabilities of Visual Basic programming language to provide an easy-to-use process analysis and optimization environment. AIR SEPARATORS MODELS Various modeling methods have been developed to describe air separators™ performance and simulate t heir operations. In the following sections three main ty pes of mathematical models, i.e., those which are based on Discrete Element Methods (DEM), Computational Fluid Dynamics (CFD) and empirical relationships are explained. Discrete Element Method (DEM) This method considers factors affecting discrete particles in any processing equipment. In any air classification process, there are three main acting forces which cause separation of particles into coarse and fine streams. They are called gravity, centrifugal and a ir drag forces. It is the balance of these three forces whi ch determines classification cut size (d 50 ). Centrifugal (F c) and air drag (F d) forces for a spherical shape are as follow [10]: r**r* *34F2p3pcurp= (1 ) 2*r* **cF2a2pxdupr= (2) DEM technique is increasingly used for describing breakage operation in tumbling mills. This techniqu e has been recently used for simulating and visualizing t he motion of particles inside air separators. However, relations described above are time-consuming and normally applied to discuss parameters affecting ef ficient separation process and are not used to predict prod ucts™ size distributions. Computational Fluid Dynamics (CFD) Karunakumari described computational fluid dynamics (CFD) as fia method that deals with the numerical solutions of the governing equations and constitutive laws of fluid flows and enables fairly accurate calculation of a single-phase flow field i n equipment of arbitrary geometric complexityfl [11]. The application of CFD technique to simulate cyclones and other types of gas-solid separators is also well established in the other literatures [12-14]. Karunakumari and his colleagues were successful in using this ap proach and predicted results were close to the observed da ta [11].
PAGE – 3 ============
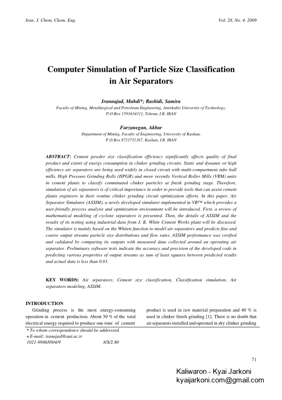
Iran. J. Chem. Chem. Eng. Computer Simulation of– Vol. 28, No. 4, 2009 73 0 10 25 50 75 100 0 100 1000 Bypass d25 d75 Feed to Coarse Stream (%) Particle Size (µm) Cut size Fish Use of CFD method is increasing as this approach of modeling is able to provide useful predictions [15] , but it is so much time consuming as Nageswararao in his re cent paper mentioned fiSuch solutions are computationally intensive; current JKMRC work on the CFD modeling o f a hydrocyclone operating under normal industrial conditions using parallel processing in a super com puter can consume two weeks of CPU time for one steady-st ate simulationfl [16]. Therefore, at the time being, acc urate predictions of empirical models that provide simple equations are preferred by developers of simulators . Empirical Models Empirical relationships have been used in most steady-state simulators to model classification in hydrocyclone devices. However, empirical models require sampling from actual circuit for calibratio n and validation before being used for simulation. Author s implemented an algorithm based on this approach of modeling due to its sufficient accuracy, high execu tion speed and lower use of computer resources during simulation runs. The usual approach to describe performance of air separators uses the concept of efficiency curves, known as selectivity curves (Fig . 1). Efficiency curves can be plotted for the percent of mass in a specific particle size class in feed stream wh ich is recovered into either coarse or fine streams. The t wo types of curves are complementary. A sharper curve represents a more efficient separation. Equations (3) and (4) are used to plot efficiency curves based on mass-balanced particle size distribution d ata and operating conditions. This requires sampling from f eed, coarse and fine streams around the air separator [1 7]. =iioa foFO100 E (3) =iiua fuFU100 E (4) It can be seen in Fig. 1 that efficiency curve does not cross the origin at zero-sized particles. The offse t on the vertical axis is due to the fibypass or short circui tingfl that may be observed in size classification devices sinc e small particles do not respond to classification forces a nd therefore enter coarser stream as misplaced materia ls. Empirical modeling of air separator devices is clos ely related to the research that has been done for mode ling of hydrocyclones. In order to simulate air sepa rators for Fig. 1: Typical shape of efficiency curve for recov ery to coarse strea. design or optimization objectives, some researchers have applied the fitting models that have already been u sed to describe efficiency curves of size separation units . Among the mathematical functions proposed for fitti ng observed efficiency curve data, those of Plitt/Reid based on Rosin-Rammler distribution and Whiten based on hyperbolic function have been widely accepted and u sed by mineral processors [17]. Plitt/Reid function to calculate fractional recovery to underflow (coarse) stream is as follows [17]: –=mc50 uc dd693 .0 exp 1E (5) By converting Plitt model to a linear relation, mod el parameters are easily determined [18]. Whiten used an exponential expression to develop a function for fi tting efficiency curves describing solids recovery to ove rflow stream. Whiten function is as follows [17]: -a+a-a=2)exp( )Xexp( 1)exp( CEoa (6) A controversial subject in performance analysis of size classification devices is observation of effic iency curves with a portion similar to fish hooks at fine end of some efficiency curves. Several researchers have contributed to the subject of fish-hook modeling [1 9-25]. It is noted that when finer cement product is neede d, it is very likely to observe the fish-hook effect.
PAGE – 4 ============
Iran. J. Chem. Chem. Eng. Irannajad, M., et al. Vol. 28, No. 4, 2009 74 Majumder and Shah experimentally verified and asserted that fish hook is a reproducible phenomeno n which can be observed in the selectivity curve of a ny centrifugal separator [23-25]. Therefore, modeling fish hook is necessary in accurate simulation of centrif ugal classifiers such as hydrocyclones and air separator s. Three general models which can be used to fit effic iency curves of hydrocyclones or air separators will be discussed in below. Finch assumed that the mass of particles reporting to coarse stream independent of classification forces due to entrainment in water will increase with decreasing particles size [19]. For simplicity, he used a line ar model to describe this phenomenon and added a new term to the right side of the Eq. (5) to obtain a model which i ncludes fish-hook effect: -+ –=oofmc50 uc dddRdd693 .0 exp 1E (7) Based on the argument that contributions of short circuiting and true classification to solids recove ry to underflow are probabilistic, Del Villar and Finch modified Eq. (7) and proposed a final fish-hook cyc lone model [20]: + — –=m50 00fuc cdd693 .0 exp 1dddR1E(8) -00fdddR Zhang used Eq. (9) to describe the efficiency curve of air classifiers [5]: 0.1 BX AX eC100 )X(E 2X+-´=a- (9) Equation (9) can also model the fish-hook phenomenon. Whiten function is another proposed mod el that can fit efficiency curve data with fish hook b ehavior at fine sizes [17]: -a+ba-abb+=2)exp( )X. .exp( )1 ))(exp( X. .1( CE**oa (10) Equation (10) can be used to fit any actual efficie ncy curve. For simple form of efficiency curve, having no fish hook phenomenon, b equals with zero when b* equals with 1. Values of parameters a, b, b*, C and d 50c are determined by back calculation procedures known as non-linear regression being discussed in mathematic s book. In recent past years, validity and accuracy of Whit en model predictions have been further tested in vario us case studies carried out by Benzer and his colleagues [6-8, 26]. They successfully applied Whiten model to simulate air classification in static and dynamic air separators installed in a number of cement plants. A property of Whiten function is that its parameters are independ ent of operating conditions, so this feature makes this fu nction more helpful in optimizing operating conditions. Authors have developed and tested ASSIM as a tool for air separator model calibration and simulation based on the Whiten function. The program can be used to analyze the performance of an installed air separat or by computing the optimal values of efficiency curve parameters (such as cut size, separation sharpness and by- pass) or to simulate the product size distribution and flow rates of fine and coarse streams based on the calib rated efficiency curve and feed data. By linking ASSIM wi th ball mill or HPGR models within a simulator structu re, whole circuit simulations would be possible. ASSIM DEVELOPMENT ASSIM is implemented in Visual Basic Programming language and uses unique features of this language to create a user-friendly environment in Microsoft TM WindowsŽ. There are five main menus at the top of t he window similar to commonly used software that provi de usual functionalities such as saving, opening and e diting data files, analyzing entered data and displaying p redicted results by different tables and graphs. ASSIM Overview ASSIM predicts characteristics of fine and coarse streams of air separators using a previously calibr ated Whiten model as discussed in section of Empirical m odel. The values of parameters which define Whiten functi on are unique for any air separator and at least one m easured data set (which is obtained by size analysis of sam ples from three streams around the air separator and rec orded operating condition during the sampling campaign) i s required to estimate them. As discussed before, non linear regression is used to estimate whiten paramete rs using
PAGE – 5 ============
Iran. J. Chem. Chem. Eng. Computer Simulation of– Vol. 28, No. 4, 2009 75 Fig. 2: The dialog box for model calibration data e ntry. sampled data. In this method starts from an estimat e for each parameter and continues by back calculations i n order to find the best value for the parameters whi ch has the least squares between measured and calculated d ata. ASSIM uses an algorithm for estimating Whiten function™s parameters in order to calibrated each air separato r. The main functions of ASSIM are fiModel Calibrationfl and fiSimulationfl. Simulation trials can be done dir ectly if the parameters of Whiten model are already known ; otherwise, model calibration is necessary to build a customized air separator model for simulation. In o rder to run model calibration procedure, the number of size fractions and flow rates of the three streams aroun d the air separator should be entered in text boxes avail able for this purpose. Size fractions and size distribut ions of the three streams in percent of mass remained in each fraction should be entered in a table available in the window (Fig. 2). By clicking fiViewfl menu, user is able to view the calibrated values of Whiten function™s parameters; the user can view simulator™s analysis of data entered for model calibration by different graphs and tables of size distributions and efficiency curves. By clicking fiR un| Classification simulationfl menu, user can enter simulation step where feed stream properties including the num ber of size fractions, mass flow and particle size dist ribution should be entered. As mentioned before, parameters of Whiten function is independent of operating paramet ers. Therefore, the user can change the operating parame ters in order to simulate the classification process and see the resulting characteristics of fine and coarse stream s. Simulation results in forms of graphs and tables of size distributions and recovery of coarse and fin e streams Fig. 3: An error message displayed by ASSIM. can be seen by clicking fiResultsfl menu. As ASSIM checks validity of the input data, any errors would be informed to the user and should be removed prior to start any other process. Fig. 3 shows an error message sh own when sum of size distributions of feed stream in worksheet of simulation data entry do not equal wit h 100 percent. Though ASSIM checks validity of data enter ed by different tools, it is essential to enter mass b alanced data to have the most accurate and reliable results . Data should be entered in order of ascending in both wor ksheet of data entry Case Study and Software Validation During development of ASSIM, different sets of data collected from a number of air separators operating in cement plants were used to verify software computat ions, non-linear algorithm and its results. Here, an ind ustrial case study is presented which constitute the develo ping database used for ASSIM validation. The performance of a real air separator was simulated. Plant data wer e supplied by J. K. White Cement Works located at Got an in Rajasthan State of India. Fig. 4 shows the simplified flowsheet of J. K. Whit e Cement Works clinker grinding circuit. The fresh fe ed (clinker mixed with high-grade gypsum) is distribut ed between the two parallel cement tube ball mills whi ch are operated in a closed circuit with a single high-eff iciency dynamic air separator. The two datasets were obtain ed by particle size analysis of the samples collected from the streams around the air separator. Particle size determination at sub-sieve range (less than 40 µm) was done by laser beam diffraction method. Table 1 show s operating conditions at the time of sampling campai gns.
PAGE – 6 ============
Iran. J. Chem. Chem. Eng. Irannajad, M., et al. Vol. 28, No. 4, 2009 76 The samples collected under two operating condition s which are completely different in terms of feed par ticle size distribution and flow rate. Therefore, the fir st data set was used to fit the actual efficiency curve by find ing the optimal values of Whiten model parameters. The obtained set of values for various parameters is us ed to indicate air separator performance for classificati on process analysis purposes and to customize and cali brate Whiten model for classification process simulation. The measured data, i.e. particles size distribution s and solids flow rates of all streams around the air sep arator, were first adjusted using NORBAL3 material balance reconciliation software [27]. Solids flow rates for fine and coarse streams were calculated based on the measure d mass flow rates of the fresh feed and average circu lating load to the tube ball mills. The values of Whiten model parameters found by running model calibration function are automaticall y exported to the classification simulation part of t he software. The efficiency curves of the air separato r computed based on the first measured dataset and Wh iten model are compared in Fig. 5. The fish-hook phenomenon is easily noticeable in these curves, which occurs at an onset particle size approximately equal to 9 µm. The quality of fitting the fish-hook part of the measured effic iency data by the implemented Whiten model is quite significant. Predications of ASSIM were then checked and validat ed using the second data set. Therefore, flow rate and size distribution of feed stream are entered to run air classification simulation step. Table 2 shows observed and predicted particle size distributions and flow rate s for fine and coarse streams. The predicted solids flow rates of fine and coarse output streams were equal to 33.8 a nd 89.70 t/h, respectively. These values are very clos e to the observed solids flow rates (33.54 and 89.96 t/h for fine and coarse streams, respectively). Particle si ze distribution curves of both output streams have bee n also compared with the measured data in Fig. 6. The close agreement of predicted particle size distributions with the measured data indicates the accuracy of the implemented model and reliability o f the developed source code. CONCLUSIONS Comparisons of ASSIM predictions with real measured data validated the results generated by simulator p rogram. Table 1: Operating conditions during two sampling p rogram from clinker grinding circuit at J.K. White Cement Works. 1st dataset 2 nd dataset Date of Sampling 19/10/2006 31/10/2006 Mills feed rate (t/h) 22, 12 24, 14 Total feed rate (t/h) 34 38 Outlet draught (mbar) 5.2, 5.1 7.3, 4.2 Cement temperature at mill outlets ( C) 109, 108 102, 122 Mills motor power draw (kW) 809, 433 784, 486 Separator fan speed (rpm) 910 905 Separator Rotor speed (rpm) 1060 1080 Table 2: Observed and predicted particle size distr ibutions of output streams around air separator of J. K. White Cement Works. Particle Size Size Distribution (µm) Observed ASSIM Observed ASSIM Fine stream Fine stream Coarse stream Coarse stream 425 100.00 100.00 100.00 100.00 300 100.00 100.00 98.01 98.00 212 100.00 100.00 73.28 73.21 150 100.00 100.00 60.09 59.98 102 99.98 99.98 38.05 37.87 72 99.88 99.88 32.66 32.47 50 98.87 98.85 25.34 25.13 36 96.93 96.88 21.82 21.62 25 91.33 91.29 18.28 18.08 18 75.04 74.91 13.41 13.29 12 63.20 63.03 11.29 11.21 8.6 49.47 49.47 9.37 9.25 6.2 40.00 40.02 7.97 7.87 4.4 30.40 30.43 6.43 6.35 3 25.22 25.29 5.52 5.44 1.8 17.39 17.38 3.90 3.86 Fig. 4: J. K. White Cement Works grinding circuit f lowsheet. Accepts Feed Rejects Cement Mill No. 1 Cement Mill No. 2 Air Separator
PAGE – 8 ============
Iran. J. Chem. Chem. Eng. Irannajad, M., et al. Vol. 28, No. 4, 2009 78 REFERENCES [1] Jankovic, A., Valery, W. and Davis, E., Cement Grinding Optimisation, Minerals Engineering , 17 , p. 1075 (2004). [2] Farzanegan, A., Laplante, A.R. and Lowther, D.A., A Knowledge-based System for an Off-Line Optimization of Ball Milling Circuits, Proceedings of 29 th CMP Conference, Ottawa, 165-185 (1997). [3] Farzanegan, A., Knowledge-Based Optimization o f Mineral Grinding Circuits, Ph.D. Thesis, McGill University, Montreal, Canada (1998). [4] Irannajad, M., Farzanegan, A. and Razavian, S .M., Spreadsheet-based Simulation of Closed Ball Milling Circuits, Minerals Engineering , 19 , 1495 (2006). [5] Zhang, Y.M., Napier-Munn, T.J. and Kavetsky, A ., Application of Comminution and Classification Modelling to Grinding of Cement Clinker, Trans. Inst. Min. Metall ., Sect. C , 97 , p. 207 (1988). [6] Benzer, H., Ergün, L., Öner, M. and Lynch, A.J ., Simulation of Open Circuit Clinker Grinding. Minerals Engineering , 14 (7), p. 701 (2001a). [7] Benzer, H., Ergün L., Lynch, A.J., Öner, M., G ünlü, A., Çelik, I.B. and Aydo an, N., Modeling Cement Grinding Circuits, Minerals Enginering , 14 (11), p. 1469 (2001b). [8] Benzer, H., Modeling and Simulation of a Full y Air Swept Ball Mill in a Raw Material Grinding Circuit, Power Technology , 150 , p. 145 (2004). [9] Yadegar, Sh. and Pishvai, M.R., Mixed Qualitat ive / Quantitative Dynamic Simulation of Processing Systems, Iranian Journal of Chemistry & Chemical Engineering , 24 , p. 53 (2005). [10] Kolacz, J., Investigating Flow Conditions in Dynamic Air Classification, Minerals Engineering , 15 , p. 131 (2002). [11] Karunakumari, L. et al., Experimental and Numerical Study of a Rotating Wheel Air Classifier, AIChE Journal , 5, p. 776 (2005). [12] Griffiths W. and Boysan, F., Computational Flu id Dynamics (CFD) and Empirical Modelling of the Performance of a Number of Cyclone Separators, Journal of Aerosol Science , 27 , p. 281 (1996). [13] Wang, Q., Melaaen, M.C. and De Silva, S .R., Investigation and Simulation of a Cross-Flow Air Classifier, Powder Technology , 22 , p. 273 (2001). [14] Bakker, A., Haidari, A.H. and Oshinowo, L.M ., Realize Greater Benefits from CFD, AIChE Journal , 47 , p. 45 (2001). [15] Gorji et al., CFD Modeling of Gas – Liquid Hydrodynamics in a Stirred Tank Reactor, Iranian Journal of Chemistry & Chemical Engineering , 42 , p. 85 (2007). [16] Nageswararao, K., Wiseman, D.M. and Napier -Munn, T.J., Two Empirical Hydrocyclone Models Revisited, Minerals Engineering , 17 , p. 671 (2004). [17] Napier-Munn, T.J., Morrell, S., Morrison, R.D. and Kojovic, T., fiMineral Comminution Circuits: Their Operation and Optimizationfl, JKMRC, The University of Queensland (1999). [18] Plitt, L.R., The Analysis of Solid-Solid Separ ations in Classifiers, CIM Bulletin , 64 , p. 42 (1971). [19] Finch, J.A., Modelling a Fish-Hook in Hydrocyc lone Selectivity Curves, Powder Technology , 36 , p. 128 (1983). [20] Del Villar, R. and Finch, J.A., Modelling the Cyclone Performance with a Size Dependent Entrainment Factor, Minerals Engineering , 5 (6), p. 661 (1992). [21] Frachon, M. and Cilliers, J. J., A General Model for Hydrocyclone Partition Curves, Chemical Engineering Journal , 73 , p. 53 (1999). [22] Nageswararao K., A Critical Analysis of the F ish- Hook Effect in Hydrocyclone Classifiers, Chemicals Engineering Journal , 80 , p. 251 (2000). [23] Majumder, A.K., Shah, H., Shukla, P. and Barnw al, J.P., Effect of Operating Variables on Shape of fiFish-Hookfl Curves in Cyclones, Minerals Engineering , 20 , p. 204 (2007). [24] Majumder, A.K., Yerriswamy, P. and Barnwal, J. P., The fiFish-Hookfl Phenomenon in Centrifugal Separation of Fine Particles, Minerals Engineering , 16 , p. 1005 (2003). [25] Shah, H., Majumder, A.K., Barnwal, J.P. and Shukla, P., fiNew Understanding on fiFish-Hookfl Effect in Hydrocyclonefl, Proceedings of MPT 2007, pp. 425-428 (2007). [26] Lynch et al., Simulation of Closed Circuit Cli nker Grinding, Zement Kalk Gibs (English Translation) , 53 , p. 560 (2001) [27] Spring, R., NORBAL 3: Software for Material Balance Reconciliation, Center de Recherché Noranda, Point-Claire, Quebec (1992).
109 KB – 8 Pages