8 days ago — this link: Extensions and Special Programs PDF PDF. 8. Totals include PUA Unemployment for the appropriate corresponding week.
108 KB – 10 Pages
PAGE – 1 ============
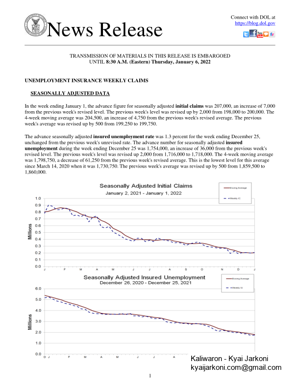
1 News Release Connect with DOL at https://blog.dol.gov TRANSMISSION OF MATERIALS IN THIS RELEASE IS EMBARGOED UNTIL 8:30 A.M. (Eastern) Thursday, , 202 UNEMPLOYMENT INSURANCE WEEKLY CLAIMS SEASONALLY ADJUSTED DATA In the week ending January 1, the advance figure for seasonally adjusted initial claims was 207,000, an increase of 7,000 from the previous week’s revised level. The previous week’s level was revised up by 2,000 from 198,000 to 200,000. The 4-week moving a verage was 204,500, an increase of 4,750 from the previous week’s revised average. The previous week’s average was revised up by 500 from 199,250 to 199,750. The advance seasonally adjusted insured unemployment rate was 1.3 percent for the week ending Dec ember 25, unchanged from the previous week’s unrevised rate. The advance number for seasonally adjusted insured unemployment during the week ending December 25 was 1,754,000, an increase of 36,000 from the previous week’s revised level. The previous week’s level was revised up 2,000 from 1,716,000 to 1,718,000. The 4 -week moving average was 1,798,750, a decrease of 61,250 from the previous week’s revised average. This is the lowest level for this average since March 14, 2020 when it was 1,730,750. The previ ous week’s average was revised up by 500 from 1,859,500 to 1,860,000.
PAGE – 2 ============
2 UNADJUSTED DATA The advance number of actual initial claims under state programs, unadjusted, totaled 3 15,469 in the week ending January 1, an increase of 57,599 (or 22.3 percent) from the previous week. The seasonal factors had expected an increase of 50,464 (or 19.6 percent) from the previous week. There were 898,610 initial claims in the comparable week in 2021. The advance unadjusted insured unemployment rate was 1.4 percent during the week ending December 25, an increase of 0.2 percentage point from the prior week. The advance unadjusted level of insured unemployment in state programs totaled 1,871,110 , an increase of 232,523 (or 14.2 percent) from the preceding week. The seasonal factors had expected an increase of 195,929 (or 12.0 percent) from the previous week. A year earlier the rate was 3.7 percent and the volume was 5,362,688. The total number of continued weeks claimed for benefits in all programs for the week ending December 18 wa s 1,722,352, a decrease of 199,869 from the previous week. There were 20,155,922 weekly claims filed for benefits in all programs in the comparable week in 2020. Dur ing the week ending December 18, Extended Benefits were available in the following 4 states: Alaska, Connecticut, New Jersey, and New Mexico. Initial claims for UI benefits filed by former Federal civilian employees totaled 723 in the week ending December 25, an increase of 28 from the prior week. There were 273 initial claims filed by newly discharged veterans, a decrease of 94 from the preceding week.
PAGE – 3 ============
3 There were 9,422 continued weeks claimed filed by former Federal civilian employees the week ending December 18, a decrease of 43 from the previous week. Newly discharged veterans claiming benefits totaled 4,236, a decrease of 528 from the prior week. The highest insured unemployment rates in the week ending December 18 were in Alaska (3.1), the Virgin Islands (2.6), New Jersey (2.3), California (2.2), Minnes ota (2.2), Puerto Rico (2.0), Illinois (1.9), Massachusetts (1.9), New York (1.8), and Rhode Island (1.8). The largest increases in initial claims for the week ending December 25 were in New Jersey (+4,660), Pennsylvania (+3,320), Ohio (+2,615), Michigan (+2,440), and New York (+2,287), while the largest decreases were in California ( – 7,320), Texas ( – 3,955), Virginia ( – 2,183), Alabama ( – 1,293), and Wisconsin ( – 1,181).
PAGE – 4 ============
4 UNEMPLOYMENT INSURANCE DATA FOR REGULAR STATE PROG RAMS WEEK ENDING January 1 December 25 Change December 18 Prior Year 1 Initial Claims (SA) 207,000 200,000 +7,000 206,000 781,000 Initial Claims (NSA) 315,469 257,870 +57,599 255,021 898,610 4-Wk Moving Average (SA) 204,500 199,750 +4,750 206,500 805,000 WEEK ENDING December 25 December 18 Change December 11 Prior Year 1 Insured Unemployment (SA) 1,754,000 1,718,000 +36,000 1,856,000 5,180,000 Insured Unemployment (NSA) 1,871,110 1,638,587 +232,523 1,827,623 5,362,688 4-Wk Moving Average (SA) 1,798,750 1,860,000 -61,2501,919,000 5,384,500 Insured Unemployment Rate (SA) 2 1.3% 1.3% 0.0 1.4% 3.5% Insured Unemployment Rate (NSA) 2 1.4% 1.2% +0.2 1.4% 3.7% INITIAL CLAIMS FILED IN FEDERAL PROGRAMS (UNADJUSTED) 3 WEEK ENDING December 25 December 18 Change Prior Year 1 Federal Employees (UCFE) 723 695 +28 1,772 Newly Discharged Veterans (UCX) 273 367 -94735 CONTINUED WEEKS CLAIMED FILED FOR UI BENEFITS IN ALL PROGRAMS (UNADJUSTED) 3 WEEK ENDING December 18 December 11 Change Prior Year 1 Regular State 1,634,502 1,823,515 -189,0135,194,541 Federal Employees 9,422 9,465 -4316,772 Newly Discharged Veterans 4,236 4,764 -5289,094 Extended Benefits 4 57,674 67,543 -9,869951,364 State Additional Benefits 5 2,186 2,434 -2482,359 STC / Workshare 6 14,332 14,500 -16891,221 TOTAL 7 1,722,352 1,922,221 -199,86920,155,922 FOOTNOTES SA – Seasonally Adjusted Data, NSA – Not Seasonally Adjusted Data Continued weeks claimed represent all weeks of benefits claimed during the week being reported, and do not represent weeks claimed by unique individuals. Prior year is comparable to most recent data. Most recent week used covered employment of 135,015,266 as denominator. NOTICE: laims for PUA and PEUC are no longer included in this news release. Any ongoing claims for these programs iration on September 6, 2021. Claims activity for these programs will continue to be posted online at: Weekly Pandemic Program Claims Information on the EB program can be found here: EB Program information Some states maintain additional benefit programs for those claimants who exhaust regular benefits, and when applicable, extended benefits. Information on states that participate, and the extent of benefits paid, can be found starting on page 4-4 of this link: Extensions and Special Programs PDF Information on STC/Worksharing can be found starting on page 9-10 of the following link: Extensions and Special Programs PDFPrior year total includes PUA and PEUC claims.
PAGE – 5 ============
5 Advance State Claims – Not Seasonally Adjusted Initial Claims Filed During Week Ended January 1 Insured Unemployment For Week Ended December 25 STATE Advance Prior Wk Change Advance Prior Wk Change Alabama 2,693 2,516 177 4,505 5,470 -965 Alaska 1,138 1,134 4 8,860 8,472 388 Arizona 1,823 1,850 -27 11,256 12,305 -1,049 Arkansas 1,569 1,771 -202 9,223 8,651 572 California 50,934 48,851 2,083 400,652 353,715 46,937 Colorado 2,239 1,683 556 19,860 17,686 2,174 Connecticut 9,294 3,302 5,992 31,003 24,552 6,451 Delaware 720 484 236 4,477 4,021 456 District of Columbia 1,219 1,583 -364 5,658 5,791 -133 Florida 4,046 4,244 -198 44,068 41,196 2,872 Georgia 5,476 2,705 2,771 35,247 25,151 10,096 Hawaii 1,793 1,394 399 9,085 8,290 795 Idaho 2,440 1,982 458 6,941 6,049 892 Illinois 14,125 13,938 187 125,547 101,021 24,526 Indiana 6,564 6,199 365 29,951 26,086 3,865 Iowa 5,075 3,583 1,492 19,531 15,253 4,278 Kansas 1,455 1,368 87 6,029 5,113 916 Kentucky 2,755 2,396 359 10,192 10,118 74 Louisiana 1,482 1,623 -141 15,060 16,438 -1,378 Maine 1,434 1,198 236 6,984 6,073 911 Maryland 3,639 3,177 462 21,724 21,842 -118 Massachusetts 13,522 9,883 3,639 66,428 60,067 6,361 Michigan 19,827 15,268 4,559 52,582 48,984 3,598 Minnesota 9,225 7,872 1,353 73,663 59,130 14,533 Mississippi 1,338 1,078 260 5,039 5,490 -451 Missouri 4,745 5,903 -1,158 19,417 18,649 768 Montana 1,669 1,588 81 8,088 6,770 1,318 Nebraska 1,629 1,295 334 4,715 4,028 687 Nevada 2,749 2,269 480 19,954 20,903 -949 New Hampshire 950 674 276 2,695 2,701 -6 New Jersey 15,270 12,298 2,972 89,452 83,787 5,665 New Mexico 1,513 1,599 -86 11,025 10,551 474 New York 26,580 17,658 8,922 195,286 144,913 50,373 North Carolina 1,735 1,923 -188 16,939 17,424 -485 North Dakota 918 933 -15 4,820 3,703 1,117 Ohio 12,269 11,966 303 48,263 42,268 5,995 Oklahoma 1,427 1,762 -335 12,714 12,894 -180 Oregon 7,168 4,895 2,273 34,088 29,922 4,166 Pennsylvania 18,231 11,425 6,806 84,089 81,058 3,031 Puerto Rico 700 1,109 -409 9,966 16,155 -6,189 Rhode Island 1,973 2,266 -293 9,120 7,780 1,340 South Carolina 3,582 1,135 2,447 13,651 11,031 2,620 South Dakota 401 470 -69 2,080 1,718 362 Tennessee 4,106 4,766 -660 15,969 15,064 905 Texas 13,057 11,236 1,821 112,998 101,705 11,293 Utah 1,670 1,478 192 7,967 7,536 431 Vermont 980 804 176 3,868 2,952 916 Virgin Islands 19 41 -22 608 898 -290 Virginia 1,942 1,204 738 12,133 4,904 7,229 Washington 11,766 7,188 4,578 57,282 48,378 8,904 West Virginia 946 808 138 8,694 7,411 1,283 Wisconsin 11,120 7,536 3,584 39,113 34,581 4,532 Wyoming 529 559 -30 2,551 1,939 612 US Total 315,469 257,870 57,599 1,871,110 1,638,587 232,523 Note: Advance claims are not directly comparable to claims reported in prior weeks. Advance claims are reported by the state liable for paying the unemployment compensation, whereas previous weeks reported claims reflect claimants by state of residence. In addition, claims reported as “workshare equivalent” in the previous week are added to the advance claims as a proxy for the current week’s “workshare equivalent” activity.
PAGE – 6 ============
6 Seasonally Adjusted US Weekly UI Claims (in thousands) Week Ending Initial Claims Change from Prior Week 4-Week Average Insured Unemployment Change from Prior Week 4-Week Average IUR December 26, 2020 763 -40 823.00 5,180 -131 5,384.50 3.5 January 2, 2021 781 18 805.00 5,240 60 5,291.00 3.7 January 9, 2021 904 123 812.75 5,061 -179 5,198.00 3.6 January 16, 2021 886 -18 833.50 4,878 -183 5,089.75 3.4 January 23, 2021 836 -50 851.75 4,791 -87 4,992.50 3.4 January 30, 2021 837 1 865.75 4,655 -136 4,846.25 3.3 February 6, 2021 863 26 855.50 4,592 -63 4,729.00 3.2 February 13, 2021 847 -16 845.75 4,469 -123 4,626.75 3.1 February 20, 2021 747 -100 823.50 4,383 -86 4,524.75 3.1 February 27, 2021 761 14 804.50 4,157 -226 4,400.25 2.9 March 6, 2021 734 -27 772.25 4,123 -34 4,283.00 2.9 March 13, 2021 765 31 751.75 3,841 -282 4,126.00 2.7 March 20, 2021 658 -107 729.50 3,753 -88 3,968.50 2.6 March 27, 2021 729 71 721.50 3,717 -36 3,858.50 2.6 April 3, 2021 742 13 723.50 3,708 -9 3,754.75 2.7 April 10, 2021 586 -156 678.75 3,652 -56 3,707.50 2.6 April 17, 2021 566 -20 655.75 3,653 1 3,682.50 2.6 April 24, 2021 590 24 621.00 3,680 27 3,673.25 2.6 May 1, 2021 507 -83 562.25 3,640 -40 3,656.25 2.6 May 8, 2021 478 -29 535.25 3,738 98 3,677.75 2.7 May 15, 2021 444 -34 504.75 3,611 -127 3,667.25 2.6 May 22, 2021 405 -39 458.50 3,769 158 3,689.50 2.7 May 29, 2021 388 -17 428.75 3,517 -252 3,658.75 2.5 June 5, 2021 374 -14 402.75 3,528 11 3,606.25 2.5 June 12, 2021 418 44 396.25 3,412 -116 3,556.50 2.5 June 19, 2021 416 -2 399.00 3,484 72 3,485.25 2.5 June 26, 2021 368 -48 394.00 3,367 -117 3,447.75 2.4 July 3, 2021 386 18 397.00 3,265 -102 3,382.00 2.4 July 10, 2021 368 -18 384.50 3,262 -3 3,344.50 2.4 July 17, 2021 424 56 386.50 3,296 34 3,297.50 2.4 July 24, 2021 399 -25 394.25 2,980 -316 3,200.75 2.2 July 31, 2021 387 -12 394.50 2,899 -81 3,109.25 2.1 August 7, 2021 377 -10 396.75 2,865 -34 3,010.00 2.1 August 14, 2021 349 -28 378.00 2,908 43 2,913.00 2.1 August 21, 2021 354 5 366.75 2,805 -103 2,869.25 2.0 August 28, 2021 345 -9 356.25 2,852 47 2,857.50 2.1 September 4, 2021 312 -33 340.00 2,715 -137 2,820.00 2.0 September 11, 2021 335 23 336.50 2,820 105 2,798.00 2.1 September 18, 2021 351 16 335.75 2,811 -9 2,799.50 2.1 September 25, 2021 364 13 340.50 2,727 -84 2,768.25 2.0 October 2, 2021 329 -35 344.75 2,603 -124 2,740.25 1.9 October 9, 2021 296 -33 335.00 2,480 -123 2,655.25 1.8 October 16, 2021 291 -5 320.00 2,239 -241 2,512.25 1.7 October 23, 2021 283 -8 299.75 2,101 -138 2,355.75 1.6 October 30, 2021 271 -12 285.25 2,209 108 2,257.25 1.6 November 6, 2021 269 -2 278.50 2,109 -100 2,164.50 1.6 November 13, 2021 270 1 273.25 2,055 -54 2,118.50 1.5 November 20, 2021 194 -76 251.00 1,954 -101 2,081.75 1.4 November 27, 2021 227 33 240.00 1,999 45 2,029.25 1.5 December 4, 2021 188 -39 219.75 1,867 -132 1,968.75 1.4 December 11, 2021 205 17 203.50 1,856 -11 1,919.00 1.4 December 18, 2021 206 1 206.50 1,718 -138 1,860.00 1.3 December 25, 2021 200 -6 199.75 1,754 36 1,798.75 1.3 January 1, 2022 207 7 204.50
PAGE – 8 ============
8 INITIAL CLAIMS FILED DURING WEEK ENDED DECEMBER 25 INSURED UNEMPLOYMENT FOR WEEK ENDED DECEMBER 18 CHANGE FROM CHANGE FROM ALL PROGRAMS EXCLUDING RAILROAD RETIREMENT STATE NAME STATE LAST WEEK YEAR AGO UCFE 1 UCX 1 STATE (%) 2 LAST WEEK YEAR AGO UCFE 1 UCX 1 Alabama 2,516 -1,293 -2,990 7 4 5,470 0.3 -492 -17,583 20 17 5,507 Alaska 1,134 -144 -2,789 12 1 8,472 3.1 -222 -11,319 156 10 8,638 Arizona 1,850 -656 -4,719 7 1 12,305 0.4 -1,943 -57,470 143 17 12,465 Arkansas 1,771 110 -1,892 0 0 8,651 0.8 -5 -11,217 47 14 8,712 California 48,851 -7,320 -119,881 220 59 353,715 2.2 -68,057 -694,799 1,961 863 356,539 Colorado 1,683 -480 -15,019 7 4 17,686 0.7 -2,374 -85,565 214 124 18,024 Connecticut 3,302 -879 -5,446 4 8 24,552 1.6 1,148 -49,178 46 36 24,634 Delaware 484 97 -1,902 1 3 4,021 0.9 -97 -8,303 14 7 4,042 District of Columbia 1,583 524 -72 9 1 5,791 1.1 -682 -20,789 129 3 5,923 Florida 4,244 -916 -22,289 13 31 41,196 0.5 -4,730 -99,369 162 130 41,488 Georgia 2,705 272 -16,255 10 12 25,151 0.6 -6,636 -112,089 242 97 25,490 Hawaii 1,394 -464 -2,070 3 3 8,290 1.7 -1,721 -20,541 59 60 8,409 Idaho 1,982 124 -2,244 35 0 6,049 0.8 499 -5,657 269 4 6,322 Illinois 13,938 687 -96,548 6 2 101,021 1.9 -22,335 -226,623 490 145 101,656 Indiana 6,199 1,365 -5,814 4 1 26,086 0.9 -312 -47,782 145 30 26,261 Iowa 3,583 241 -3,558 3 2 15,253 1.1 1,112 -22,770 46 15 15,314 Kansas 1,368 91 -15,239 2 2 5,113 0.4 -338 -64,240 33 20 5,166 Kentucky 2,396 -894 -10,404 2 0 10,118 0.6 -2,676 -31,716 52 9 10,179 Louisiana 1,623 -300 -6,623 4 1 16,438 1.0 -715 -44,203 45 20 16,503 Maine 1,198 143 -1,469 3 0 6,073 1.1 -76 -7,620 19 6 6,098 Maryland 3,177 666 -10,452 7 3 21,842 0.9 -1,369 -54,142 180 97 22,119 Massachusetts 9,883 2,260 -13,505 11 7 60,067 1.9 1,283 -99,019 185 73 60,325 Michigan 15,268 2,440 -4,550 3 2 48,984 1.3 -7,839 -116,219 148 33 49,165 Minnesota 7,872 607 -8,399 4 6 59,130 2.2 -323 -70,005 173 60 59,363 Mississippi 1,078 -332 -4,127 0 1 5,490 0.5 -173 -22,728 43 11 5,544 Missouri 5,903 157 -7,938 4 0 18,649 0.7 172 -24,758 95 20 18,764 Montana 1,588 136 -949 35 1 6,770 1.5 112 -9,030 538 12 7,320 Nebraska 1,295 73 -1,299 0 1 4,028 0.4 332 -8,394 16 4 4,048 Nevada 2,269 -410 -4,940 13 0 20,903 1.7 -666 -57,471 153 47 21,103 New Hampshire 674 101 -2,607 3 0 2,701 0.4 -28 -18,441 8 2 2,711 New Jersey 12,298 4,660 -8,164 19 10 83,787 2.3 -5,036 -54,474 198 194 84,179 New Mexico 1,599 -126 -1,988 7 0 10,551 1.4 -380 -33,915 261 23 10,835 New York 17,658 2,287 -33,766 10 14 144,913 1.8 648 -244,628 261 245 145,419 North Carolina 1,923 -461 -6,795 4 1 17,424 0.4 -1,634 -64,258 64 77 17,565 North Dakota 933 52 -307 3 1 3,703 1.0 271 -2,128 13 0 3,716 Ohio 11,966 2,615 -16,845 5 16 42,268 0.8 921 -111,155 76 85 42,429 Oklahoma 1,762 -954 -3,269 7 7 12,894 0.9 -516 -26,238 83 45 13,022 Oregon 4,895 320 -6,123 55 3 29,922 1.7 -1,040 -52,062 617 75 30,614 Pennsylvania 11,425 3,320 -26,854 22 5 81,058 1.5 -86 -219,831 213 66 81,337 Puerto Rico 1,109 88 16 6 2 16,155 2.0 -5,286 -51,393 191 52 16,398 Rhode Island 2,266 1,169 -3,306 1 0 7,780 1.8 439 -12,049 37 32 7,849 South Carolina 1,135 -69 -3,182 3 0 11,031 0.6 -403 -29,323 32 52 11,115 South Dakota 470 -19 -185 4 0 1,718 0.4 162 -1,966 54 5 1,777 Tennessee 4,766 690 -5,384 7 3 15,064 0.5 212 -31,134 38 21 15,123 Texas 11,236 -3,955 -20,212 43 39 101,705 0.9 -14,753 -266,061 638 950 103,293 Utah 1,478 -388 -1,251 40 1 7,536 0.5 389 -7,067 191 13 7,740 Vermont 804 279 -293 0 0 2,952 1.1 -119 -7,136 2 0 2,954 Virgin Islands 41 -14 -11 0 0 898 2.6 34 -626 0 0 898 Virginia 1,204 -2,183 -10,686 1 0 4,904 0.1 -39,366 -58,539 31 29 4,964 Washington 7,188 1,002 -12,713 28 11 48,378 1.5 -2,380 -124,930 374 219 48,971 West Virginia 808 -285 -1,304 1 3 7,411 1.2 -543 -11,130 44 39 7,494 Wisconsin 7,536 -1,181 -6,758 11 1 34,581 1.3 -1,388 -55,347 118 24 34,723 Wyoming 559 -4 -273 14 0 1,939 0.8 -31 -2,769 55 4 1,998 Totals 257,870 2,849 -565,642 723 273 1,638,587 1.2 -189,036 -3,587,199 9,422 4,236 1,652,245 Figures appearing in columns showing over -the -week changes reflect all revisions in data for prior week submitted by state agencies. 1. The Unemployment Compensation program for Federal Employees (UCFE) and the Unemployment Compensation for Ex-servicemembers (UCX) exclude claims filed jointly under other programs to avoid duplication. 2. Rate is not seasonally adjusted. The source of U.S. total covered employment is BLS.
PAGE – 9 ============
9 UNADJUSTED INITIAL CLAIMS FOR WEEK ENDED DECEMBER 25, 20 21 STATES WITH AN INCREASE OF MORE THAN 1,000 State Change NJ +4,660 PA +3,320 OH +2,615 MI +2,440 NY +2,287 MA +2,260 IN +1365 RI +1,169 WA +1,002 State Suppli ed Comment No comment. Layoffs in the transportation and warehousing, accommodation and food services, and administrative and support and waste management and remediation services industries. Layoffs in t he manufacturing industry. No comment. Layoffs in t he administrative and support and waste management and remediation services, information, and transportation and warehousing industries. No comment. No comment. Layoffs in the transportati on and warehousing, accommodation and food services, construction, and administrative and support and waste management and remediation services industries. Layoffs in the agriculture, forestry, fishing and hunting, utilities, construction, manufacturing, and transportation an d warehousing industries. STATES WITH A DECREASE OF MORE THAN 1,000 State Change State Supplied Comment CA -5,549Fewer layoffs in the services and agriculture, forestry, fishing and hunting industries . TX -4,520No comment. VA -1,915No comment. AL -1,699Fewer layoffs in the retail trade and accommodation and food services industries. WI -1,321Fewer layoffs in the retail trade and management of companies and e nterprises industries.
PAGE – 10 ============
10 TECHNICAL NOTES This news release presents the weekly unemployment insurance (UI) claims reported by each state’s unemployment insurance program offices. These claims may be used for monitoring workload volume, asses sing state program operations and for assessing labor market conditions. States initially report claims directly taken by the state liable for t he benefit payments, regardless of where the claimant who filed the claim resided. These are the basis for the a dvance initial claims and continued claims reported each week. These data come from ETA 538, Advance Weekly Initial and Continued Claims Report. The following week initial claims and continued claims are revised based on a second reporting by states that r eflect the claimants by state of residence. These data come from the ETA 539, Weekly Claims and Extended Benefits Trigger Data Report. A. Initial Claims An initial claim is a claim filed by an unemployed individual after a separation from an employer. The claimant requests a determination of basic eligibility for the UI program. When an initial claim is filed with a state, certain programmatic activities take place and these result in activity counts including the count of initial claims. The count of U.S. initial claims for unemployment insurance is a leading economic indicator because it is an indication of emerging labor market conditions in the country. However, these are weekly administrative data which are difficult to seasonally adjust, making the ser ies subject to some volatility. B. Continued Weeks Claimed A person who has already filed an initial claim and who has experienced a week of unemployment then files a continued claim to claim benefits for that week of unemployment. On a weekly basis, cont inued claims are also referred to as insured unemployment, as continued claims reflect a good approximation of the current number of insured unemployed workers filing for UI benefits. The count of U.S. continued weeks claimed is also a good indicator of la bor market conditions. While continued claims are not a leading indicator (they roughly coincide with economic cycles at their peaks and lag at cycle troughs), they provide confirming evidence of the direction of the U.S. economy. C. Seasonal Adjustments a nd Annual Revisions Over the course of a year, the weekly changes in the levels of initial claims and continued claims undergo regularly occurring fluctuations. These fluctuations may result from seasonal changes in weather, major holidays, the opening and closing of schools, or other similar events. Because these seasonal events follow a more or less regular pattern each year, their influence on the level of a series can be tempered by adjusting for regular seasonal variation. These adjustments make trend and cycle developments easier to spot. At the beginning of each calendar year, the Bureau of Labor Statistics provides the Employment and Training Administration (ETA) with a set of seasonal factors to apply to the unadjusted data during that year. Concurr ent with the implementation and release of the new seasonal factors, ETA incorporates revisions to the UI claims historical series caused by updates to the unadjusted data. Weekly Claims Ar chives Weekly Claims Data U.S. Department of Labor news materials are accessible at http://www.dol.gov . The Department’s Reasonable Accommodation Resource Center converts Departmental information and documents into alternative formats, which include Braill e and large print. For alternative format requests, please contact the Department at (202) 693 -7828 (voice) or (800) 877 -8339 (federal relay). U.S. Department of Labor Employment and Training Administration Washington, D.C. 20210 Release Number: USDL 22 -6-NAT Program Contacts: Kevin Stapleton: (202) 693 -3009 Media Contact: (202) 693 -4676
108 KB – 10 Pages